
Trading Screener
From Raw Data to a 3x Revenue Engine

Starting point
Digash is a real-time crypto trading screener. I joined the team as a product designer to improve the UX/UI across their cross-platform application.
The company had solid backend logic and a loyal user base — but the product was underperforming on key business metrics. I redesigned the full UX/UI: streamlined filters, built cleaner layouts, reworked notification system, simplified pricing — and boosted registration-to-subscription conversion from 3 to 14%. But more on that later.
This case study focuses on how I conceptualized and launched the flagship Depth Map — a visual tool that quickly became the platform’s key selling point and helped double paid conversions.
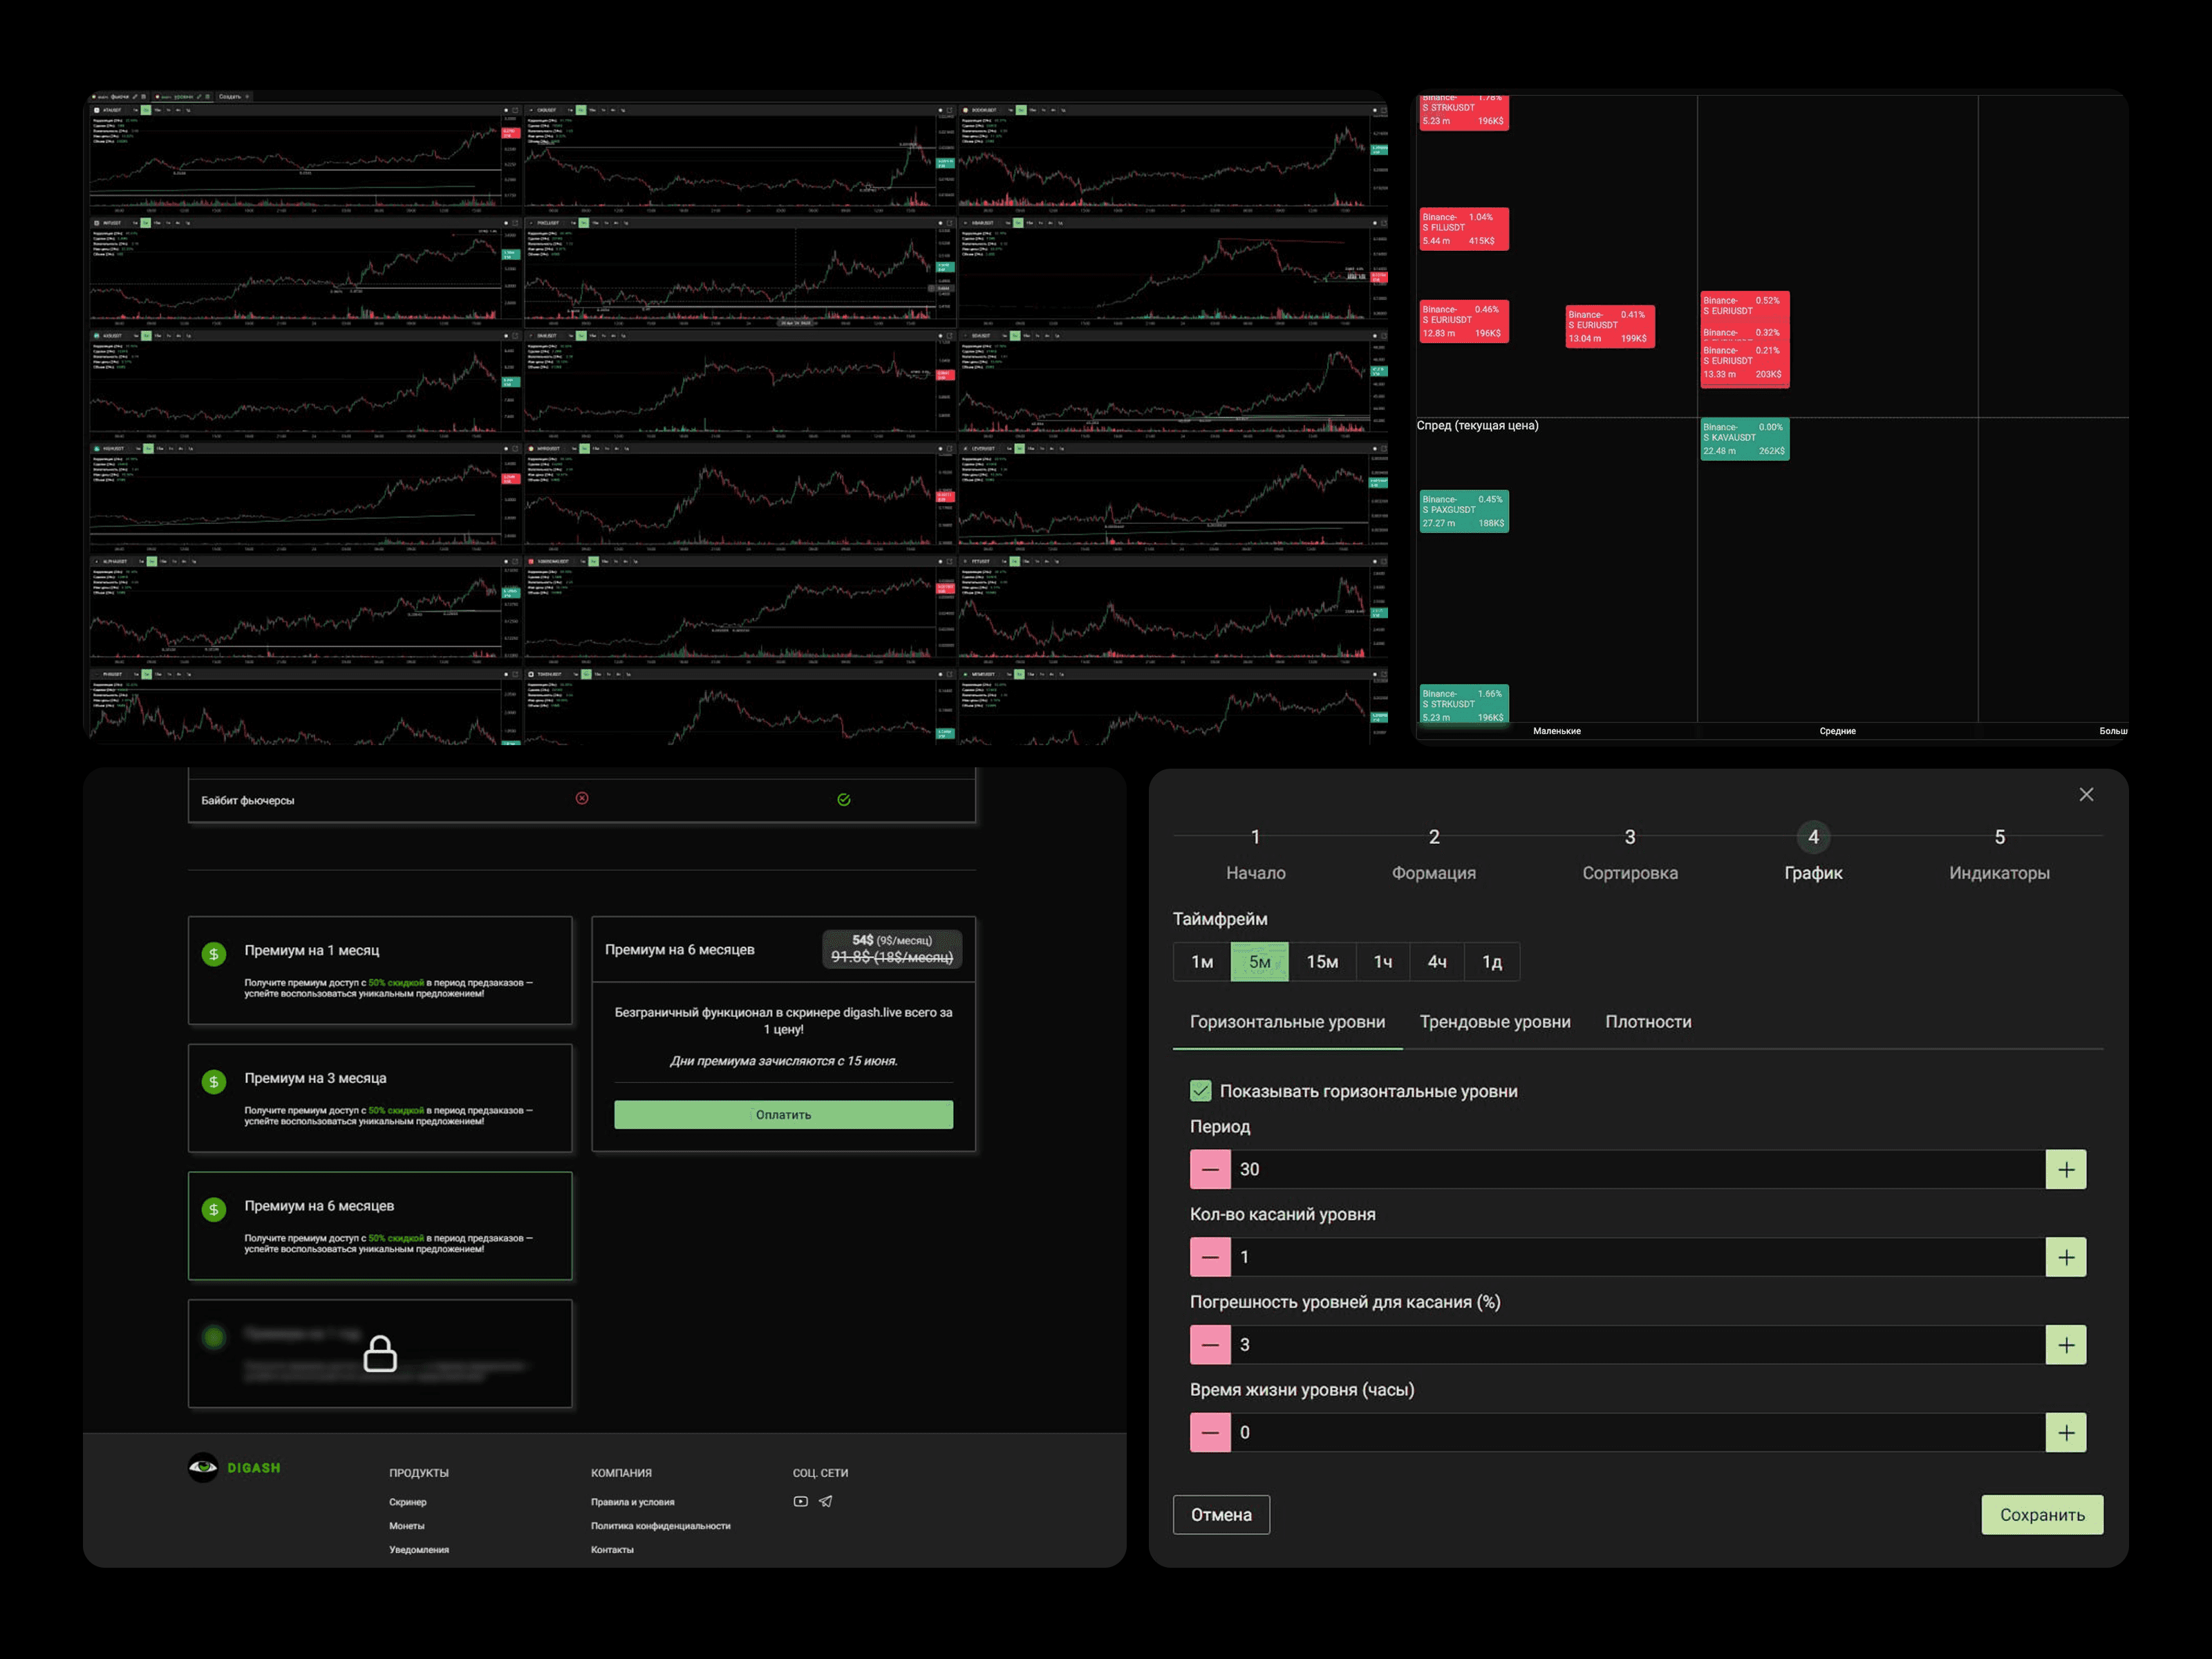
Old UI with raw tables:
Meet the Challenge
From User Research to a New Mental Model. A common pain point quickly surfaced: beginners didn’t understand liquidity clusters or the raw order book. Pros needed precision. Instead of sticking with traditional tables, I proposed a new visual format to make liquidity clusters easier to grasp.
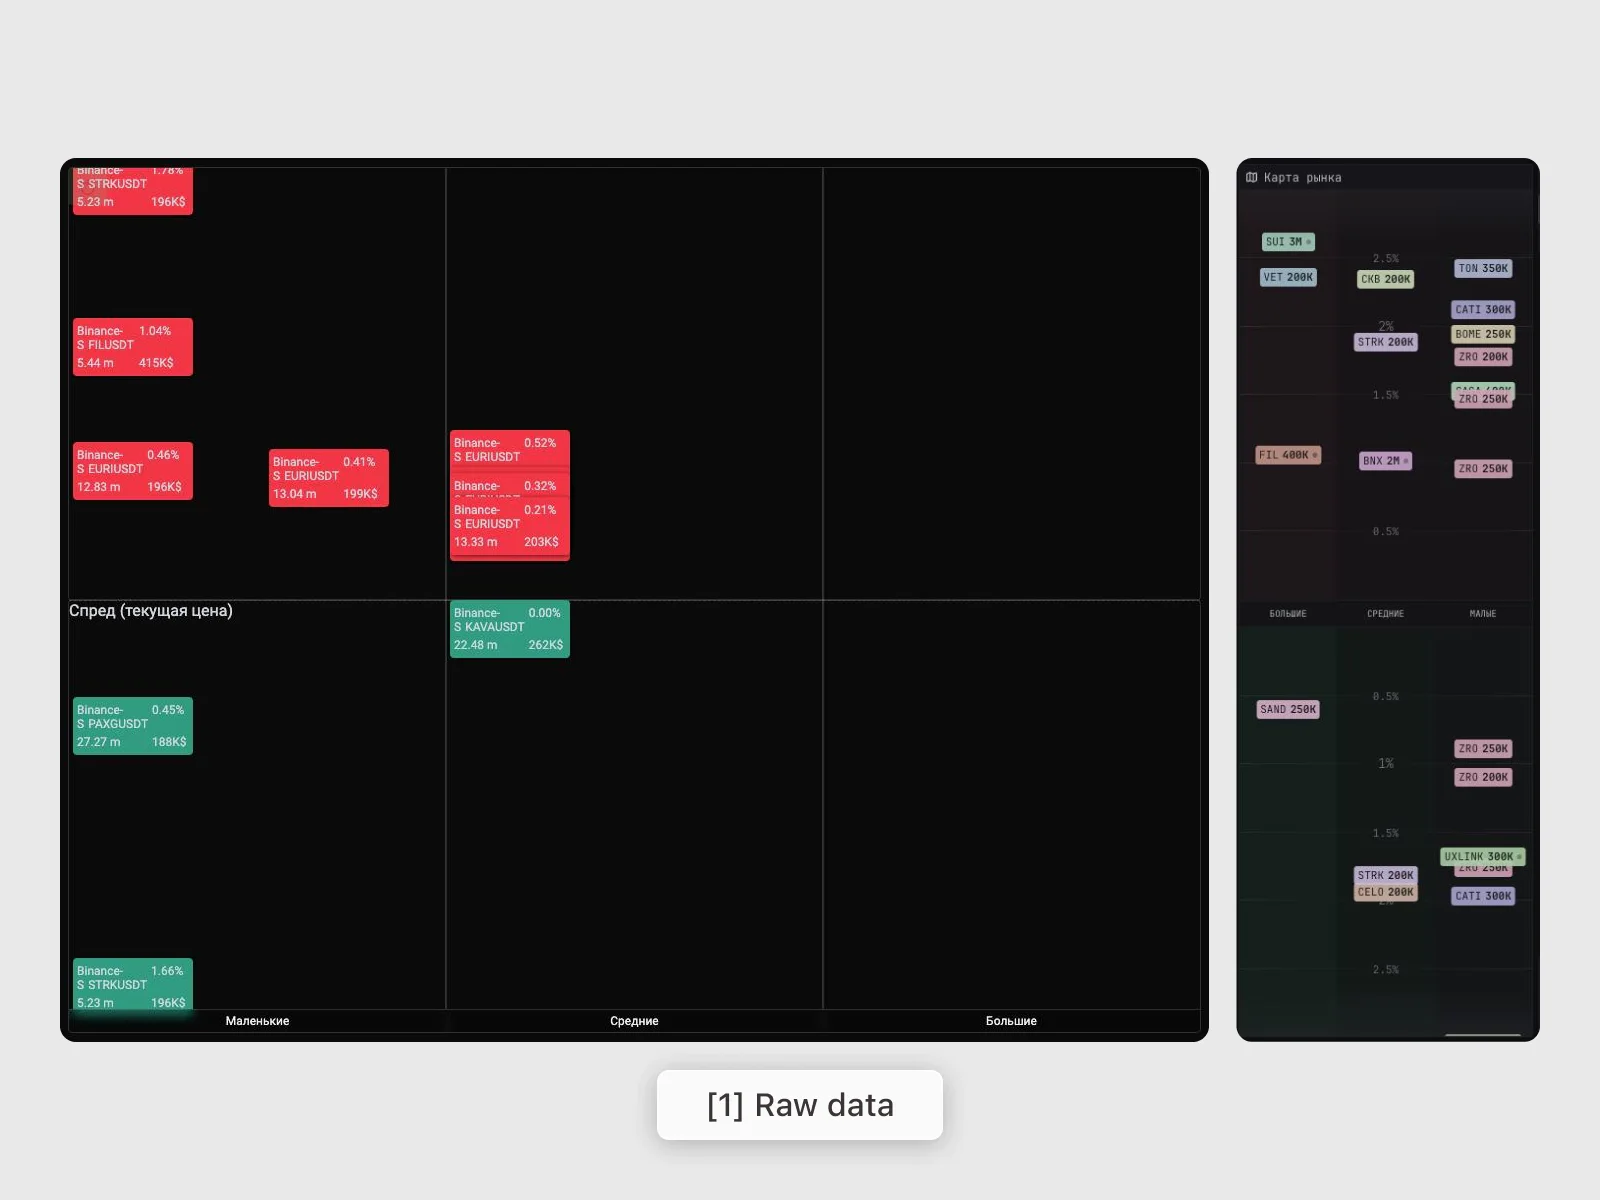
I had raw liquidity data — like in Bookmap or TradingLite — but didn’t want to clone complex tools. I wanted something visually simple. The team suggested layouts: a 3x3 grid by proximity and size, and a wave-style shape. I tested both and rejected them — they wasted space, overlapped clusters, and confused users.
My first prototype was a scatter plot: X = distance from price, Y = volume. It collapsed in the center, but it sparked the core idea — use distance as a visual anchor.
Full Depth Map process: sketches → failed layouts → XY → final concept:
Breakthrough & Impact
The Depth Map: A Radial View of Liquidity Clusters.
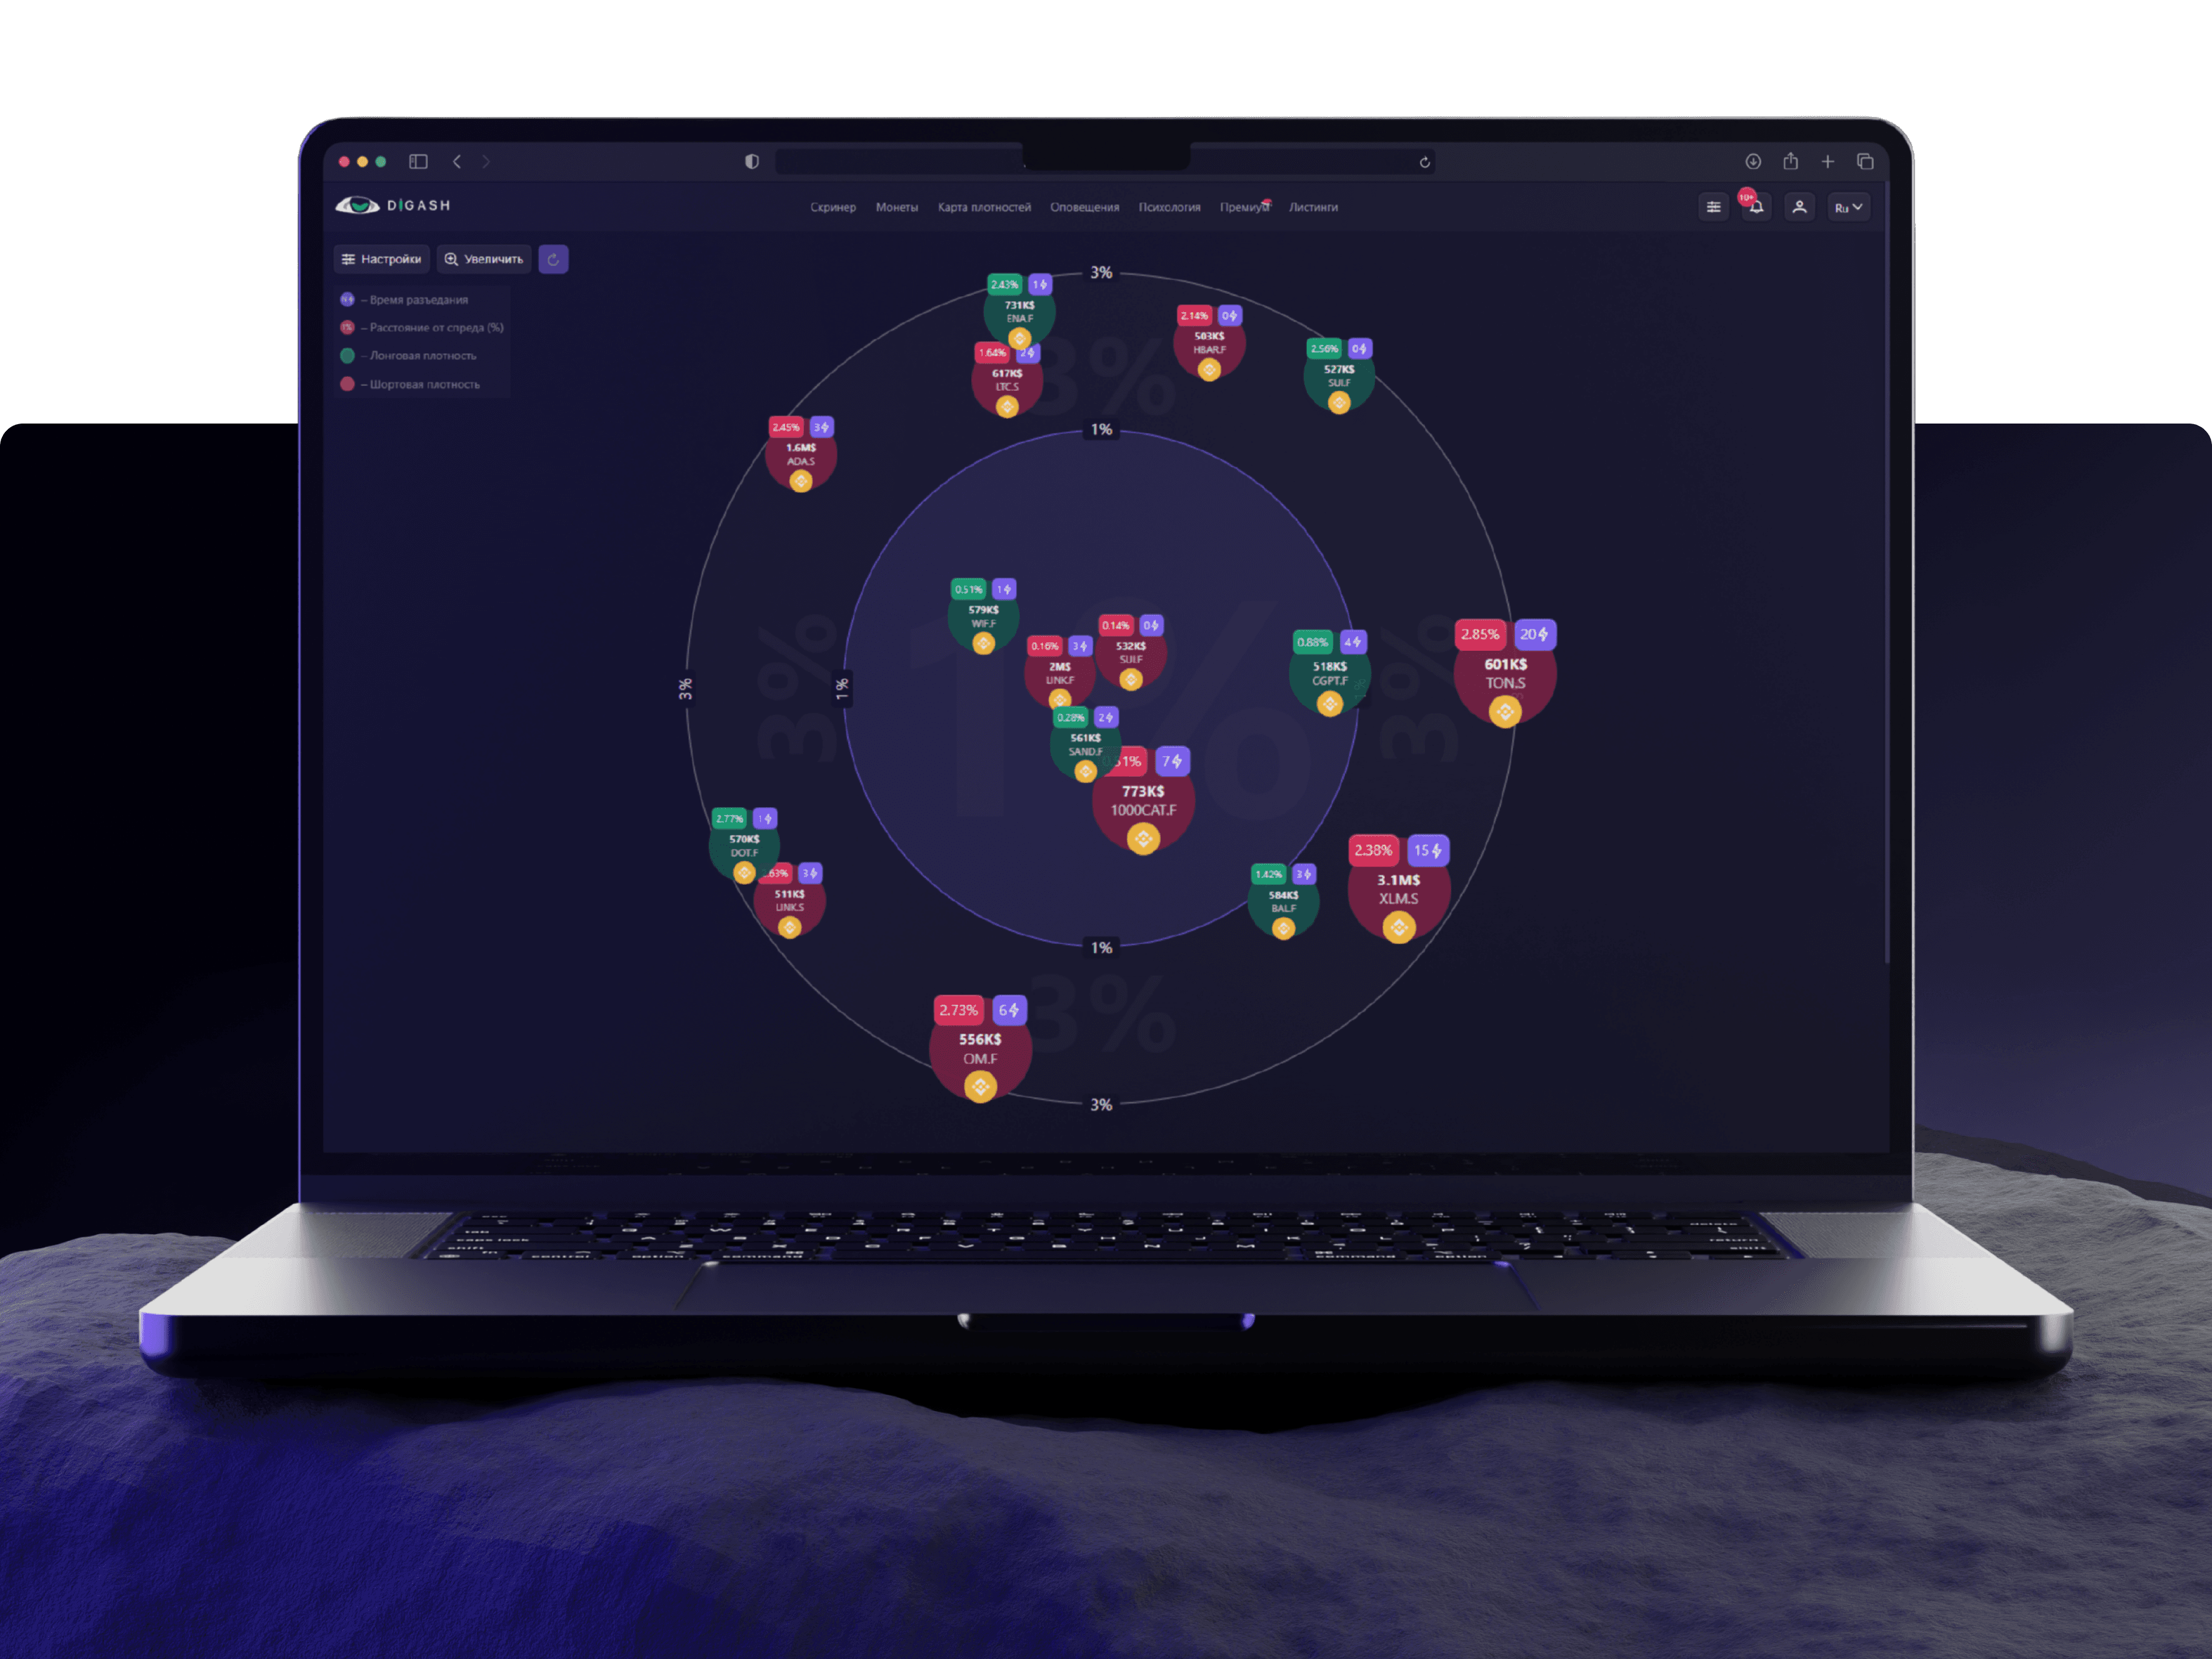
Building on the scatter plot, I shifted to a radial format — inspired by radar UIs. Each bubble = liquidity cluster. Radius = % distance from price. Size = volume. Color = buy/sell.
It offered instant clarity. New users “got it.” Pros found precision. To serve power users, I also added a sortable depth widget with traditional order book logic.
Results That Mattered:
Depth Map became the most mentioned feature in feedback
Revenue doubled post-launch
Converted YouTube traffic (mostly beginners) into paid users
Retention improved via better onboarding
Final version of the Depth Map, plus density widget UI:

But More Than That…
Full UX/UI Redesign. Before I even started working on the Depth Map, I redesigned the full product experience from the ground up:
Redesigned core screens end-to-end
Simplified numerous settings
Built an advanced notifications center
Clear filters & logic
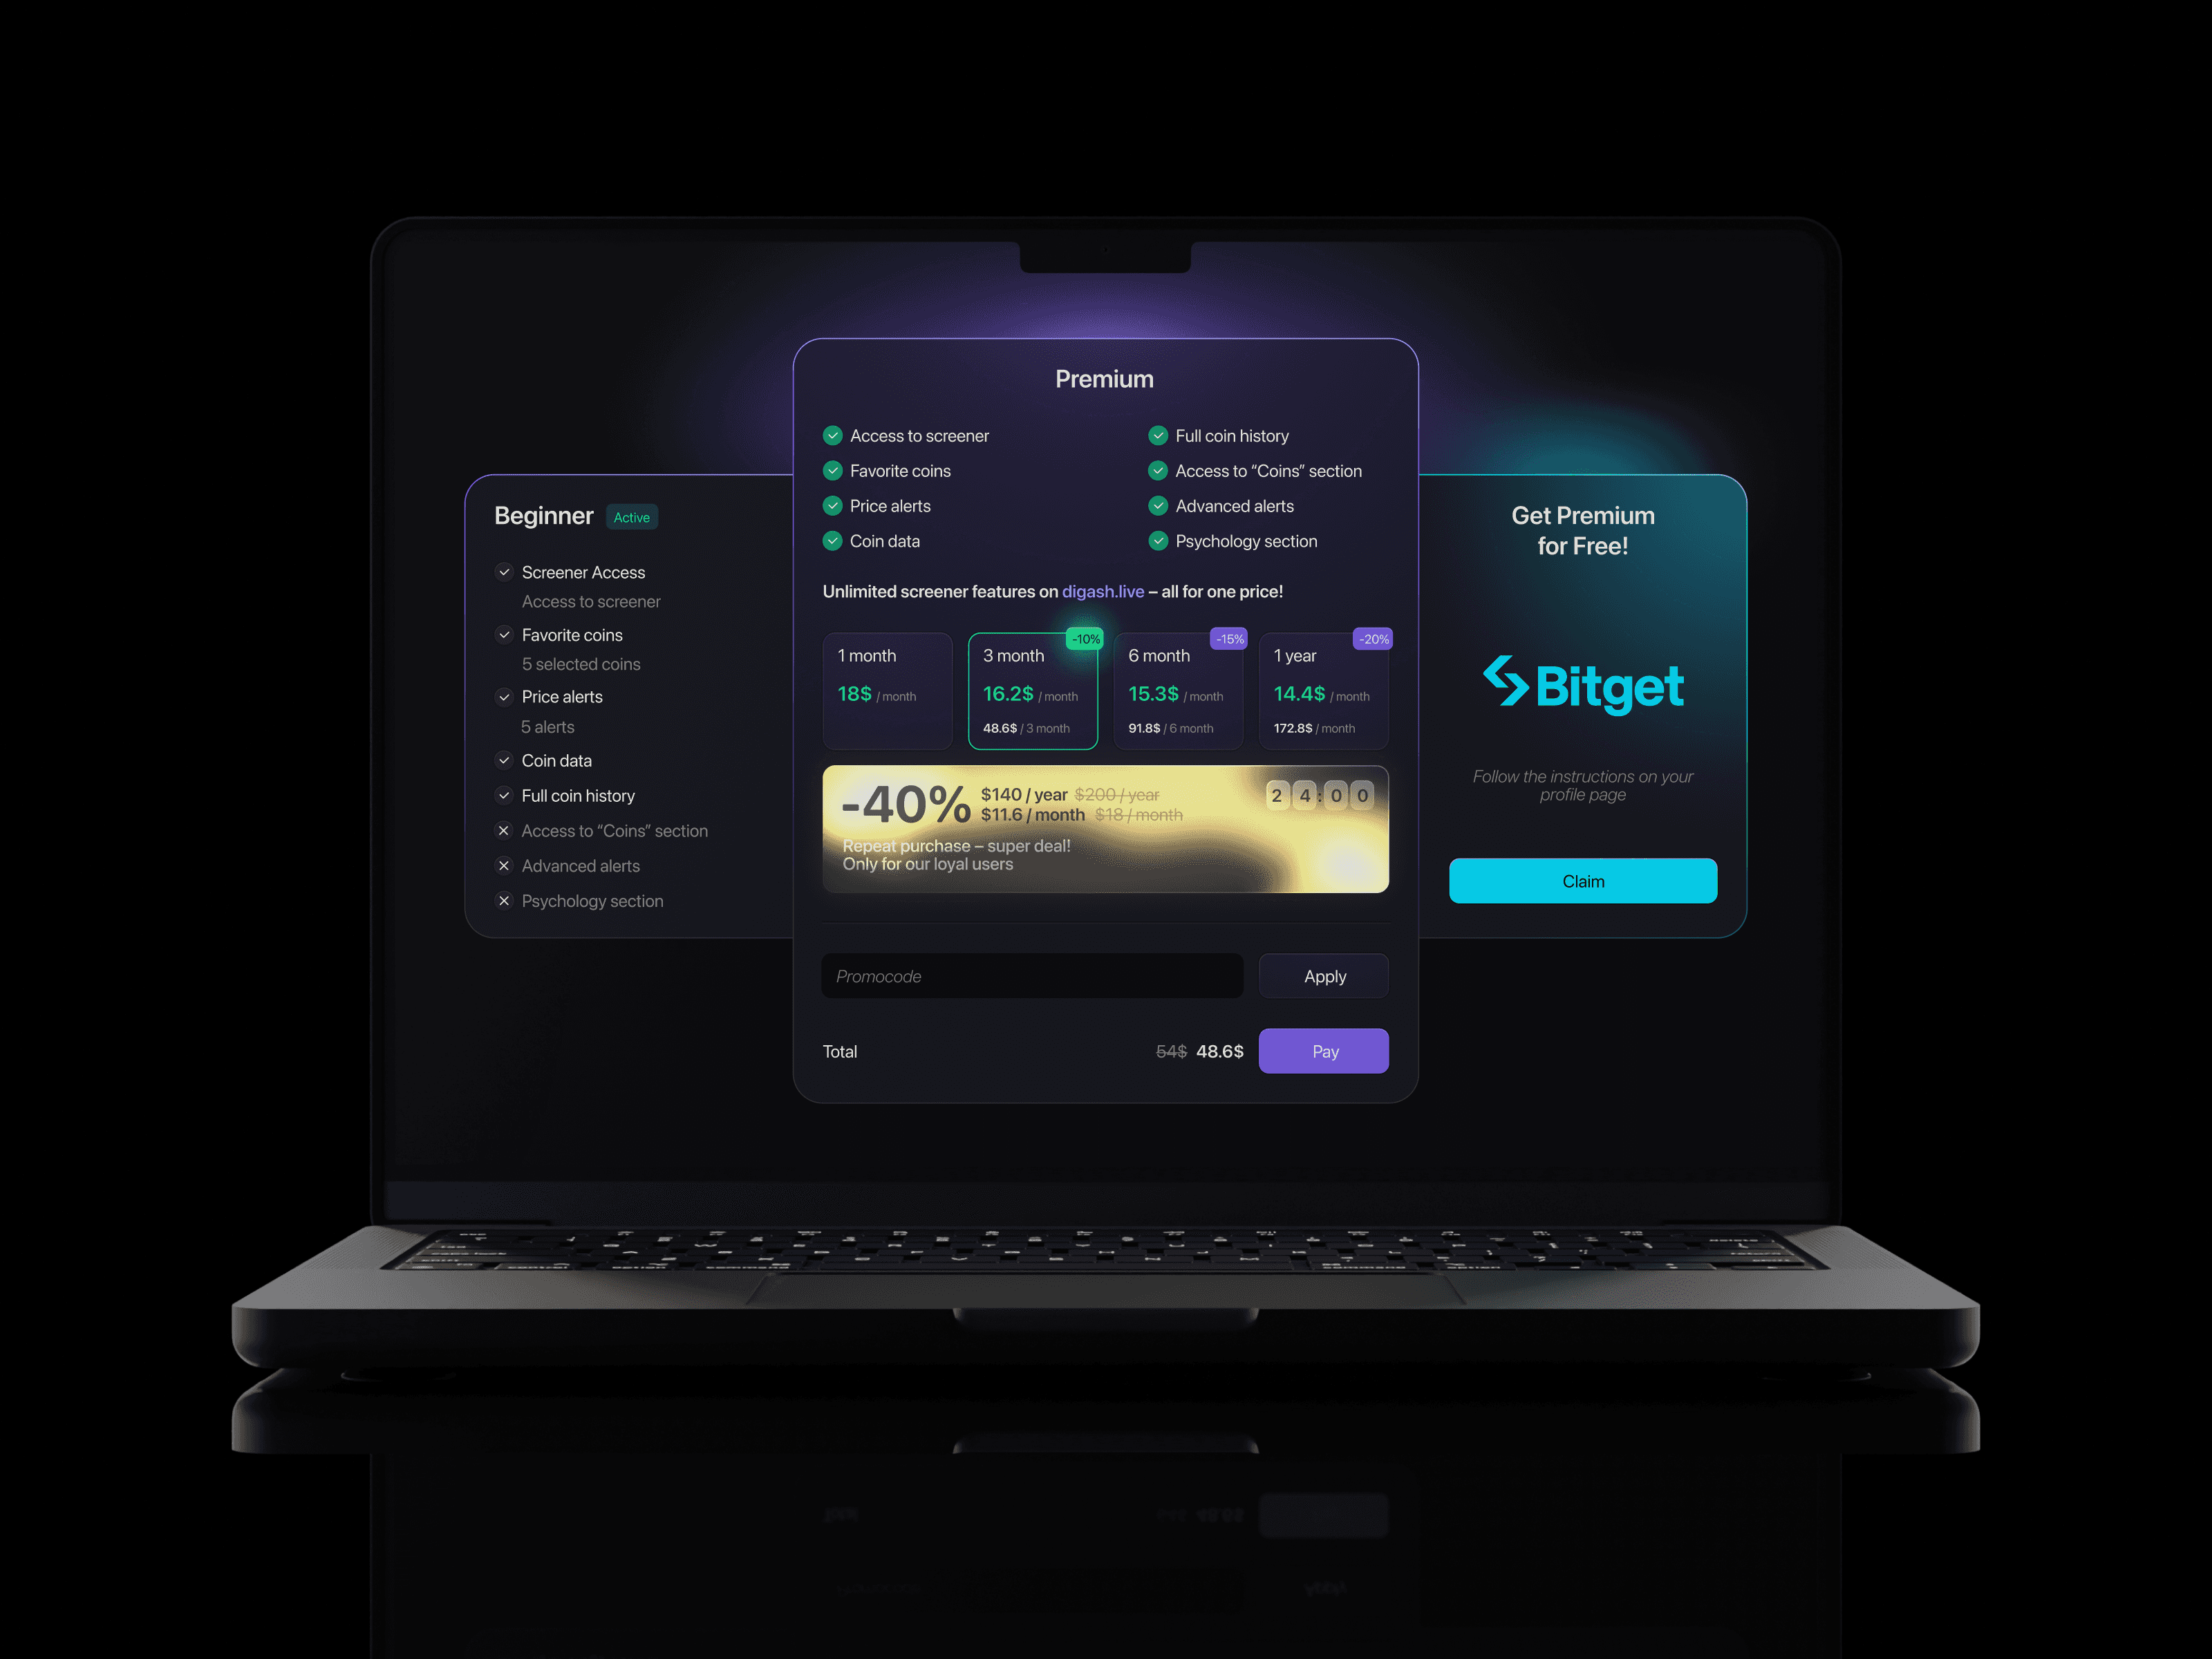
Simplified pricing
Mobile-ready
These changes took registration to conversion rate from 3% to 14% — before Depth Map launched.


Final Reflection
The Depth Map succeeded because it directly solved user pain and bridged two audiences:
Simplified liquidity for beginners
Retained accuracy for pros
It became most recognized and loved feature — and a cornerstone of the brand.
Combined with the full UX/UI overhaul, this led to:
2× revenue growth
14% conversion rate
Stronger retention
One product, reimagined from the ground up.